Some years ago, my colleague Barry Rowlingson drew my attention to the monthly NHS prescribing data that has been freely available since late 2011. We had long been interested in developing statistical methods for extracting the signal from georeferenced electronic health records and this seemed another opportunity to see what we could find.
To investigate geographical variation in monthly expenditure, simply mapping monthly spend by GP practice location is too crude, because GP practices vary widely in size and in the demographic composition of their patients. By linking the prescribing data to data on the demographics of English GP practices Barry was able to adjust each practice’s monthly spend for their numbers of registered patients in the relevant demographic group, for any medication issued under an NHS prescription. We also decided to smooth out chance fluctuations in the adjusted spend by mapping, for any location in England, a weighted average of adjusted spend over a circular region centred on the location in question, with radius chosen to encompass a total registration of approximately 100,000, so that the mapped values would have the same precision at every point on the map. Finally, because some variation in adjusted spending between practices is to be expected, we applied a statistical filter to identify areas where local adjusted spending differed from the England-wide average by a factor of four or more in either direction.
We were surprised to find very large variations (up to a factor of ten or more) in adjusted spending. One example, shown here for September 2013 by the two panels of Figure 1, was in the prescribing rates for methylphenidate, the NICE-recommended treatment for ADHD in children. The contrast between prescribing rates north and south of the Mersey estuary is striking.
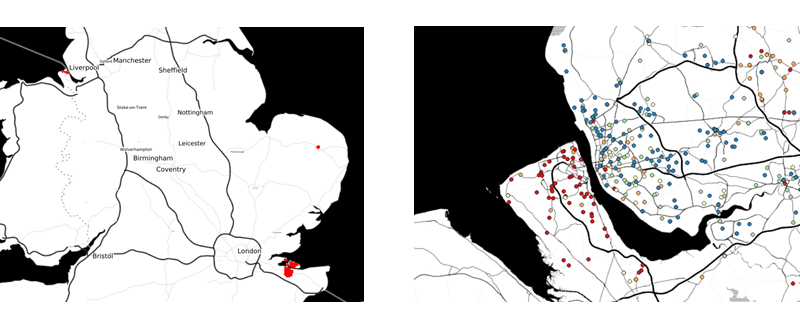
Figure 1. In the left-hand panel, areas coloured red are those for which there is strong evidence that underlying prescribing rates (adjusted spend per registered child aged 9 to 16) were at least four times the national average in September 2013. The right-hand panel shows the actual adjusted spend per registered child for practices north and south of the Mersey, coloured by quintile of spend per child aged 9 to 16 (blue=lowest, red=highest)
With two Lancaster colleagues, fellow-statistician Ben Taylor and medical practitioner Euan Lawson, we published our results in BMJ Open (Rowlingson et al, 2013) and, as is often the way with academic research (arguably too often – mea culpa), left it at that.
But after catching a recent Radio 4 news item debating the supposed “medicalisation” of ADHD, I found myself wondering if what we had found back in 2013 was a transient or a persistent phenomenon. Barry was able to reproduce our analysis using the December 2018 data, and found the patterns of extremely high methylphenidate prescribing to be largely unchanged (Figure 2). What the explanation is for these extremes, and in particular the persistent contrast between methylphenidate prescribing rates on either side of the Mersey, I cannot say. But I find it hard to believe that it is an accurate reflection of an underlying difference in medical need between these two geographically neighbouring, but socio-economically very different, areas of north-west England.
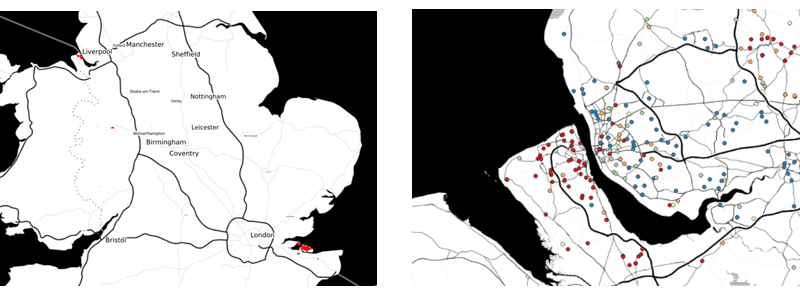
Figure 2. In the left-hand panel, areas coloured red are those for which there is strong evidence that underlying prescribing rates (adjusted spend per registered child) were at least four times the national average in September 2013. The right-hand panel shows the actual adjusted spend per registered child for practices north and south of the Mersey, coloured by quintile of spend per child aged 9 to 16 (blue=lowest, red=highest)
We are far from the only group to have mapped aspects of the prescribing data. Particularly noteworthy is the OpenPrescribing project led by Ben Goldacre at the EBM DataLab, University of Oxford, which offers a high degree of interactivity but does not yet include assessments of statistical uncertainty in its maps or its many other useful graphical displays of the data.
Rowlingson, B., Lawson, E., Taylor, B. and Diggle, P.J. (2013). Mapping English GP prescribing data: a tool for monitoring health-service inequalities. BMJ Open, 3:e001363,
doi:10.1136/bmjopen-2012-001363